Abstract
Accurate and rapid detection of brain tumors in magnetic resonance imaging (MRI) scans is critical for timely diagnosis and effective treatment planning. Manual interpretation of MRI data is time-consuming, subject to inter-observer variability, and limited in scalability, which highlights the need for automated solutions. This study presents a robust deep learning framework based on the latest YOLOv11 object detection architecture for real-time localization of brain tumors. A four-phase pipeline is implemented, consisting of dataset preparation, baseline training, hyperparameter optimization, and model evaluation. The Roboflow Universe Brain Tumor Dataset, including annotated categories of glioma, meningioma, pituitary tumor, and healthy cases, is preprocessed and partitioned into training, validation, and test sets to ensure unbiased assessment. Two YOLOv11 variants are systematically trained and evaluated. The YOLOv11m, achieved an mAP@50 of 0.9063, precision of 0.8858, and recall of 0.8614, delivering highly competitive results compared to YOLOv11s (mAP@50 = 0.9076). While YOLOv11s showed a marginal 0.14% higher detection accuracy. A comprehensive data analysis is performed using precision–recall curves, confusion matrices, ROC curves, and class-wise performance metrics to identify strengths and limitations across tumor categories. Notably, performance varied by tumor type: No Tumor (AP = 0.973) and Meningioma (AP = 0.964) achieved near-perfect detection, while Glioma (AP = 0.741) remained more challenging due to irregular shapes and contrast variations. These results demonstrate that YOLOv11m can deliver competitive detection accuracy with significantly faster inference than YOLOv11s and traditional CNN-based approaches, thereby enhancing both speed and reliability in automated neuro-oncological diagnostics. Future research will focus on integrating cross-dataset generalization, improving boundary localization (mAP@50–95), and extending the framework to multimodal MRI scans to support broader clinical applications. These results demonstrate the potential of advanced real-time object detection architectures in enhancing the speed and reliability of automated neuro-oncological diagnostics, supporting clinical workflows with consistent and precise tumor identification.
|
Published in
|
Journal of Cancer Treatment and Research (Volume 13, Issue 4)
|
|
DOI
|
10.11648/j.jctr.20251304.13
|
|
Page(s)
|
107-118 |
|
Creative Commons
|

This is an Open Access article, distributed under the terms of the Creative Commons Attribution 4.0 International License (http://creativecommons.org/licenses/by/4.0/), which permits unrestricted use, distribution and reproduction in any medium or format, provided the original work is properly cited.
|
|
Copyright
|
Copyright © The Author(s), 2025. Published by Science Publishing Group
|
Keywords
Brain Tumor Detection, Magnetic Resonance Imaging (MRI), YOLOv11, Object Detection, Real-Time Medical Imaging, Automated Diagnosis
1. Introduction
Brain tumors are among the most severe and life-threatening neurological disorders, arising from abnormal and uncontrolled cellular growth within brain tissue. Early and accurate detection is essential to support treatment planning, improve prognosis, and reduce mortality. Magnetic resonance imaging (MRI) remains the gold standard diagnosstic modality due to its superior soft-tissue contrast and non-invasive nature. However, interpreting MRI scans requires significant clinical expertise and is prone to human error, particularly in detecting small, irregularly shaped, or low-contrast tumors. Recent advances in deep learning have transformed medical image analysis by enabling faster, more accurate, and automated diagnostic support. Convolutional neural networks (CNNs), in particular, have shown remarkable ability in extracting complex features and classifying tumor types from MRI data. Despite these advances, most existing methods rely on classification or segmentation pipelines that lack real-time capability, limiting their utility in urgent clinical workflows. Moreover, the trade-off between detection accuracy and computational efficiency remains a critical challenge, particularly for deployment in resource-constrained healthcare environments.
To address these gaps, this study introduces a YOLOv11-based framework for real-time brain tumor detection in MRI images. YOLOv11’s enhanced feature extraction, anchor-free detection, and multi-scale learning mechanisms make it especially effective for identifying tumors of varying sizes and morphologies under diverse imaging conditions. Beyond achieving high accuracy, this approach emphasizes near-instantaneous detection to support clinical decision-making and point-of-care applications. The novelty of this work lies in combining state-of-the-art detection architecture with MRI-specific preprocessing, targeted hyperparameter tuning, and benchmarking against baseline deep learning models. By doing so, this research moves closer to bridging the gap between experimental prototypes and clinically deployable solutions for real-time tumor detection.
2. Literature Review
Despite rapid progress in medical image analysis, several challenges persist in brain tumor detection. Earlier studies have often focused on classification or segmentation without addressing the urgent need for real-time detection that balances both accuracy and efficiency. Many high-performing models remain validated only on controlled datasets, with limited testing on diverse real-world MRI images that present variability in tumor type, size, and imaging quality. The following review traces the chronological development of approaches—from traditional CNNs to hybrid and attention-based architectures—highlighting advancements, limitations, and remaining opportunities. Early CNN-based studies provided proof of concept but faced challenges in generalization. For instance, Kahn et al. (2020) developed a custom CNN model that outperformed pre-trained models such as VGG16 and ResNet50, achieving 100% accuracy on a small dataset. However, the authors warned of overfitting and emphasized the need for larger, more diverse datasets to ensure robustness
| [10] | Khan, Hassan Ali, Wu Jue, Muhammad Mushtaq, and Muhammad Umer Mushtaq. 2020. “Brain Tumor Classification in MRI Image Using Convolutional Neural Network.” Mathematical Biosciences and Engineering. AIMSPress. September 15, 2020. https://doi.org/10.3934/mbe.2020328 |
[10]
. Similarly, Alsubai et al. (2022) introduced a CNN-LSTM hybrid for MRI-based tumor detection, where CNNs captured spatial features and LSTMs modeled sequential patterns. While promising, the model faced challenges in detecting small tumors and lacked comprehensive accuracy reporting
| [15] | Alsubai, Shtwai, Habib Ullah Khan, Abdullah Alqahtani, Mohemmed Sha, Sidra Abbas, and Uzma Ghulam Mohammad. 2022. “Ensemble Deep Learning for Brain Tumor Detection.” Frontiers in Computational Neuroscience. U.S. National Library of Medicine. September 2, 2022. https://doi.org/10.3389/fncom.2022.1005617 |
[15]
.
Between 2021 and 2024, researchers explored ensemble methods and hybrid frameworks to boost classification performance. Chen et al. (2021) employed ensemble CNNs for COVID-19 CT classification, achieving 96.7% accuracy, though dataset limitations constrained its generalizability
| [1] | Chen, Yao-Mei, Yenming J. Chen, Wen-Hsien Ho, and Jinn-Tsong Tsai. 2021. “Classifying Chest CT Images as Covid-19 Positive/Negative Using a Convolutional Neural Network Ensemble Model and Uniform Experimental Design Method - BMC Bioinformatics.” BioMed Central. BioMed Central. November 8, 2021. https://doi.org/10.1186/s12859-021-04083-x |
[1]
. AbdelAziz et al. (2024) combined a Squeeze-and-Excitation CNN with Random Forest (SECNN-RF) for Alzheimer’s detection, reporting 99.89% accuracy and demonstrating the role of explainability via saliency maps
| [2] | AbdelAziz, Nabil M, Wael Said, Mohamed M AbdelHafeez, and Asmaa H Ali. 2024. “Advanced Interpretable Diagnosis of Alzheimer’s Disease Using SECNN-RF Framework with Explainable AI.” Frontiers in artificial intelligence, September 2, 2024. https://doi.org/10.3389/frai.2024.1456069 |
[2]
. Ahmed et al. (2024) proposed a hybrid Vision Transformer–GRU model for brain tumor detection, achieving 98.97% accuracy and using SHAP and Grad-CAM for interpretability, but noted difficulties in handling diverse multimodal datasets
| [7] | Ahmed, Md. Mahfuz, Md. Maruf Hossain, Md. Rakibul Islam, Md. Shahin Ali, Abdullah Al Noman Nafi, Md. Faisal Ahmed, Kazi Mowdud Ahmed, et al. 2024. “Brain Tumor Detection and Classification in MRI Using Hybrid VIT and GRU Model with Explainable AI in Southern Bangladesh.” Nature News. Nature Publishing Group. October 1, 2024. https://doi.org/10.1038/s41598-024-71893-3 |
[7]
. Ragab et al. (2024) introduced BTR-EODLA, integrating SE-ResNet50 with autoencoders, achieving 98.78% accuracy but facing dataset size limitations
| [16] | Ragab, Mahmoud, Iyad Katib, Sanaa A. Sharaf, Hassan A. Alterazi, Alanoud Subahi, Sana G. Alattas, Sami Saeed Binyamin, and Jaber Alyami. 2024. “Automated Brain Tumor Recognition Using Equilibrium Optimizer with Deep Learning Approach on MRI Images.” Nature News. Nature Publishing Group. November 27, 2024. https://doi.org/10.1038/s41598-024-80888-z |
[16]
.
Recent works have leveraged transfer learning, attention mechanisms, and lightweight models for improved robustness. Abdusalomov et al. (2023) applied YOLOv7 with attention and feature fusion, reaching 99.5% accuracy but struggling with extreme tumor variations
| [3] | Abdusalomov, Akmalbek Bobomirzaevich, Mukhriddin Mukhiddinov, and Taeg Keun Whangbo. 2023. “Brain Tumor Detection Based on Deep Learning Approaches and Magnetic Resonance Imaging.” MDPI. Multidisciplinary Digital Publishing Institute. August 18, 2023. https://doi.org/10.3390/cancers15164172 |
[3]
. Wong et al. (2025) fine-tuned VGG16 for brain tumor classification, achieving 99.24% accuracy but limited by narrow dataset diversity
| [4] | Wong, Yuki, Eileen Lee Ming Su, Che Fai Yeong, William Holderbaum, and Chenguang Yang. 2025. “Brain Tumor Classification Using MRI Images and Deep Learning Techniques.” PLOS ONE. Public Library of Science. May 9, 2025. https://doi.org/10.1371/journal.pone.0322624 |
[4]
. Asif et al. (2025) combined InceptionV3 and Xception, attaining 99.76% accuracy but requiring significant computational resources
| [5] | Asif, Rizwana Naz, Muhammad Tahir Naseem, Munir Ahmad, Tehseen Mazhar, Muhammad Adnan Khan, Muhammad Amir Khan, Amal Al-Rasheed, and Habib Hamam. 2025. “Brain Tumor Detection Empowered with Ensemble Deep Learning Approaches from MRI Scan Images.” Nature News. Nature Publishing Group. April 29, 2025. https://doi.org/10.1038/s41598-025-99576-7 |
[5]
. Aamir et al. (2025) designed a multi-stage ensemble achieving 99.94% accuracy with low hardware requirements but lacked explainability tools
| [11] | Aamir, Muhammad, Ziaur Rahman, Uzair Aslam Bhatti, Waheed Ahmed Abro, Jameel Ahmed Bhutto, and Zhonglin He. 2025. “An Automated Deep Learning Framework for Brain Tumor Classification Using MRI Imagery.” Nature News. Nature Publishing Group. May 21, 2025. https://doi.org/10.1038/s41598-025-02209-2 |
[11]
.
Lightweight and interpretable models have also gained traction. Taher et al. (2022) proposed BRAIN TUMOR-Net, achieving 100% accuracy on glioma and pituitary tumors, but requiring validation on external datasets
| [6] | Taher, Fatma, Mohamed R. Shoaib, Heba M. Emara, Khaled M. Abdelwahab, Fathi E. Abd El Samie, and Mohammad T. Haweel. 2022. “Efficient Framework for Brain Tumor Detection Using Different Deep Learning Techniques.” Frontiers. Frontiers. December 1, 2022. https://doi.org/10.3389/fpubh.2022.959667 |
[6]
. Nazir et al. (2024) integrated CNNs with explainable AI, achieving 99% accuracy while highlighting challenges in cross-dataset generalization
| [9] | Nazir, Imran, Afsana Akter, Anwar Hussen Wadud, and Ashraf Uddin. 2024. “Utilizing Customized CNN for Brain Tumor Prediction with Explainable AI.” Utilizing Customized Cnn for Brain Tumor Prediction with Explainable Ai. SSRN. May 23, 2024. https://dx.doi.org/10.2139/ssrn.4834282 |
[9]
. Iftikhar et al. (2025) employed a simplified CNN with Grad-CAM, reaching 99% accuracy but reporting performance drops (94%) on unseen datasets
| [8] | Iftikhar, Shagufta, Nadeem Anjum, Abdul Basit Siddiqui, Masood Ur Rehman, and Naeem Ramzan. 2025. “Explainable CNN for Brain Tumor Detection and Classification through XAI Based Key Features Identification - Brain Informatics.” SpringerOpen. Springer Berlin Heidelberg. April 30, 2025. https://doi.org/10.1186/s40708-025-00257-y |
[8]
. Ishfaq et al. (2025) advanced edge-AI for real-time classification, achieving 99.33% detection accuracy but requiring optimization for latency and energy efficiency
| [13] | Ishfaq, Qurat Ul Ain, Rozi Bibi, Abid Ali, Faisal Jamil, Yousaf Saeed, Rana Othman Alnashwan, Samia Allaoua Chelloug, and Mohammed Saleh Ali Muthanna. 2025. “Automatic Smart Brain Tumor Classification and Prediction System Using Deep Learning.” Nature News. Nature Publishing Group. April 28, 2025. https://doi.org/10.1038/s41598-025-95803-3 |
[13]
. Balakrishna & Rao (2025) proposed MLCED-Net for low-dose CT, achieving 98.9% accuracy but lacking validation on standard CT data
| [12] | Balakrishna, Katari, and A Nagaraja Rao. 2024. “Advancing Brain Tumor Detection and Classification in Low-Dose CT Images Using the Innovative Multi-Layered Deep Neural Network Model.” Technology and Health Care: Official Journal of the European Society for Engineering and Medicine. U.S. National Library of Medicine. December 29, 2024. https://doi.org/10.1177/09287329241302558 |
[12]
. Samee et al. (2022) introduced GN-AlexNet with SE blocks, achieving 99.51% accuracy but also noting limited external validation
| [14] | Samee, Nagwan Abdel, Noha F. Mahmoud, Ghada Atteia, Hanaa A. Abdallah, Maali Alabdulhafith, Mehdhar S. A. M. Al-Gaashani, Shahab Ahmad, and Mohammed Saleh Ali Muthanna. 2022. “Classification Framework for Medical Diagnosis of Brain Tumor with an Effective Hybrid Transfer Learning Model.” MDPI. Multidisciplinary Digital Publishing Institute. October 20, 2022. https://doi.org/10.3390/diagnostics12102541 |
[14]
. In 2024, Khalighi (Khalighi et al., 2024) offered a comprehensive review of AI in neuro-oncology, focusing on glioma diagnosis, prognosis, and personalized treatment strategies. The review pointed out advanced models such as nnU-Net, which achieved high accuracy in automating tumor segmentation and supporting imaging analysis for clinical use. It also highlighted the predictive power of Deep Learning–based imaging signatures (DLIS), particularly their ability to non-invasively identify 1p/19q co-deletion status from preoperative MRI scans. However, the authors note that only 29.4% of original AI studies included external validation and stress the importance of addressing racial, socioeconomic, and demographic disparities to develop AI solutions that are fair and effective across diverse populations
| [18] | Khalighi, Sirvan, Kartik Reddy, Abhishek Midya, Krunal Balvantbhai Pandav, Anant Madabhushi, and Malak Abedalthagafi. “Artificial Intelligence in Neuro-Oncology: Advances and Challenges in Brain Tumor Diagnosis, Prognosis, and Precision Treatment.” NPJ precision oncology, March 29, 2024. https://doi.org/10.1038/s41698-024-00575-0 |
[18]
.
In 2022, Almadhoun and Abu‑Naser (Almadhoun & Abu‑Naser, 2022) created deep learning algorithms aimed at identifying brain tumors through MRI scans. They trained these models on a dataset comprising 10,000 images, evaluating InceptionV3 (99.88% F‑score), VGG16 (99.86%), ResNet50 (98.14%), MobileNet (88.98%), and their own custom model. The results indicated that InceptionV3 and VGG16 delivered the highest detection accuracy, while MobileNet's performance was comparatively lower. The study highlights the balance needed between the complexity of models and their effectiveness in clinical MRI classification tasks
| [19] | Almadhoun, Hamza Rafiq, and Samy S. Abu-Naser. “Detection of Brain Tumor Using Deep Learning” International Journal of Academic Engineering Research (IJEAR), March 28, 2022. |
[19]
.
In 2024, Mathivanan (Mathivanan et al., 2024) examined four deep transfer learning models, ResNet152, VGG19, DenseNet169, and MobileNetV3, using a Kaggle MRI dataset to classify pituitary, meningioma, glioma, and normal brains. They employed five-fold cross-validation and image enhancements to balance the data. MobileNetV3 achieved the top accuracy of 99.75%, outperforming the other models significantly. The research highlights that lightweight architectures, when properly augmented and fine-tuned, can exceed the performance of larger networks in diagnostic tasks with limited medical data
| [20] | Mathivanan, Sandeep Kumar, Sridevi Sonaimuthu, Sankar Murugesan, Hariharan Rajadurai, Basu Dev Shivahare, and Mohd Asif Shah. “Employing Deep Learning and Transfer Learning for Accurate Brain Tumor Detection.” Nature News, March 27, 2024. https://doi.org/10.1038/s41598-024-57970-7 |
[20]
.
In 2024, Shah (Shah, 2024) introduced an InceptionV3 deep learning framework designed to classify brain tumors from MRI scans. The dataset involved 7,023 greyscale images labeled as glioma, meningioma, pituitary, and no-tumor. The approach included 5-fold cross-validation and preprocessing steps like grayscale conversion, resizing, labeling, and augmentation to mitigate data imbalance. The results achieved an average accuracy of 97.12%, precision of 97.97%, recall of 96.59%, and a remarkable F1-score of 99.98%, surpassing models such as VGG19 (95%), CNN (95.55%), and DenseNet (94.4%). Although the model exhibited robustness and stability, the study acknowledged limitations due to dataset size and suggested future research with larger, more diverse MRI datasets to improve generalizability
| [21] | Shah, Sagar Bharat. “Artificial Intelligence (AI) for Brain Tumor Detection: Automating MRI Image Analysis for Enhanced Accuracy.” INPRESSCO October 25, 2024. https://doi.org/10.14741/ijcet/v.14.5.5 |
[21]
.
Collectively, these studies underscore the rapid evolution of deep learning in tumor detection, with accuracy levels consistently approaching or exceeding 99%. However, persistent gaps remain in terms of real-time detection, computational efficiency, cross-dataset generalizability, and integration of explainability for clinical trust. Against this backdrop, the present work positions YOLOv11 as a next-generation detection framework designed to address these unmet needs by delivering both accuracy and real-time performance, while ensuring adaptability to diverse MRI conditions.
3. Methodology
This study is designed to develop, train, and evaluate a robust deep learning framework for automated brain tumor detection using YOLOv11. The primary objective is to ensure accurate classification and localization of tumors in MRI scans while maintaining real-time performance suitable for clinical applications. To achieve this, a systematic workflow is established, beginning with the acquisition and preparation of a publicly available brain tumor dataset, followed by rigorous preprocessing and annotation of MRI images. The experimental pipeline incorporated multiple training strategies, including baseline evaluation, hyperparameter optimization, and augmentation studies, to refine model performance. Finally, model effectiveness was assessed using established evaluation metrics such as precision, recall, and mean average precision (mAP).
3.1. Data Preprocessing and Annotation
MRI scans were resized to a fixed resolution of 512×512 pixels to maintain consistency and compatibility with the YOLOv11 architecture. Image normalization was applied to scale pixel intensity values, enhancing contrast between tumor and background tissues. Tumor regions were manually annotated using bounding boxes to localize lesions within each scan. These annotations were converted into YOLO-compatible text files containing class identifiers and normalized bounding-box coordinates.
To improve generalization, standard data augmentation techniques were applied to the training set, including random rotations, horizontal/vertical flips, scaling, and contrast adjustments. This step was particularly critical to simulate clinical variability and prevent overfitting.
3.2. Experimental Pipeline
The experimental pipeline consisted of four phases:
1) Baseline Training – Initial model training with default hyperparameters to establish performance benchmarks.
2) Hyperparameter Optimization – Systematic tuning of learning rate, momentum, and weight decay parameters to improve detection accuracy.
3) Augmentation Studies – Comparative experiments with and without augmentation to evaluate its effect on generalization.
4) Final Model Evaluation – Selection of the best-performing model configuration for detailed assessment on the held-out test set.
3.3. YOLOv11 Model Configuration
Two YOLOv11 variants were investigated: YOLOv11s (small) and YOLOv11m (medium), selected to balance inference speed and detection accuracy. Both models were trained for a maximum of 150 epochs with batch size = 16, image size = 512, and early stopping patience = 30 epochs.
Optimization was performed using stochastic gradient descent (SGD) with an initial learning rate of 0.01, momentum of 0.937, and weight decay of 0.0005. Loss functions included bounding-box regression loss, classification loss, and distribution focal loss (DFL).
3.4. Training Environment
All experiments were executed on a workstation equipped with an NVIDIA GPU (CUDA support), using the PyTorch framework and the Ultralytics YOLOv11 implementation. Training times ranged from ~10,225 seconds (2.8 hours) for YOLOv11s to ~18,813 seconds (5.2 hours) for YOLOv11m with augmentation.
3.5. Evaluation Metrics
Performance was evaluated using multiple metrics:
1) Precision (P): ability to minimize false positives.
2) Recall (R): ability to minimize false negatives.
3) Mean Average Precision (mAP@50, mAP@50–95): detection accuracy across IoU thresholds.
4) Confusion Matrix: classification accuracy across tumor types.
5) Precision–Recall (PR) Curves and Receiver Operating Characteristic (ROC) Curves: model sensitivity and specificity.
3.6. Dataset Acquisition and Curation
This study utilized the Roboflow Universe – Brain Tumor Dataset (2023)
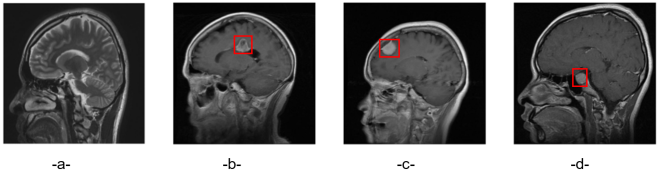
, a publicly available collection of labeled magnetic resonance imaging (MRI) scans specifically designed for brain tumor analysis. The dataset encompasses four clinically relevant categories: glioma, meningioma, pituitary tumor, and healthy (no tumor) controls. In total, the dataset contains 10,003 images, distributed as follows: No Tumor (2,369 images), Glioma (2,665 images), Meningioma (2,477 images), and Pituitary (2,462 images). Representative examples of each class are shown in
Figure 1, illustrating the diagnostic diversity across tumor types.
The curated dataset is then partitioned into three subsets to support unbiased model development and evaluation: 7218 instances (72%) for training, 1745 instances (17%) for validation, and 1010 instances (11%) for testing. This stratified division ensured balanced representation across tumor classes, allowing reliable generalization of the deep learning models.
Figure 1. Brain Tumor Types: a-No Tumor, b-Glioma, c-Meningioma, d-Pituitary.
3.7. Data Preprocessing and Model Selection
All MRI scans are preprocessed to ensure consistency and compatibility with the YOLOv11 architecture. Each image was resized to a fixed resolution of 512 × 512 pixels, maintaining dataset uniformity while preserving essential anatomical details. Pixel intensity normalization was applied to improve contrast between tumor regions and surrounding tissues, facilitating more accurate feature extraction.
For model selection, the YOLOv11 family of detectors is considered, which offers multiple variants optimized for different trade-offs between speed and accuracy. YOLOv11n (nano) is designed for edge devices with very limited computational power, while YOLOv11x (extra large) prioritizes maximum accuracy but requires high-resource offline environments. YOLOv11m and YOLOv11l provide higher accuracy with moderate to heavy computational demands, making them suitable for mid- to high-end GPU setups.
Given the current computational resources and the need for rapid experimentation, YOLOv11m (medium) is designated as the primary model for this study. It offers an enhanced balance between accuracy and efficiency, with approximately 25–28 million parameters and moderate inference speed, making it suitable for real-time MRI analysis while delivering stronger detection performance on more complex tumor features. Training is conducted on GPU-enabled environments with a batch size of 16 and an early stopping criterion of 30 epochs to prevent overtraining. Baseline training utilized default hyperparameters, while performance was continuously monitored through TensorBoard and Weights & Biases (W&B) for real-time visualization of loss curves, accuracy trends, and detection metrics.
3.8. Model Evaluation and Comparative Analysis
The trained models are evaluated on an independent test set using standard performance metrics. Precision measured the ability to minimize false positives, while recall quantified the ability to detect all true tumor regions. To capture overall detection accuracy, mAP@0.5 (mean average precision at an IoU threshold of 0.5) is calculated. In addition, mAP@0.5–0.95, averaged across multiple IoU thresholds, is reported to assess bounding-box localization quality. Beyond numerical scores, confusion matrices and visual prediction samples with bounding boxes are generated to provide qualitative insights into model behavior.
To identify the optimal configuration, multiple YOLOv11 variants are trained and compared. The selection process emphasized a balance between detection accuracy, inference speed, and computational efficiency, ensuring suitability for both clinical deployment and potential edge-computing applications.
Table 1 summarizes the comparative results between YOLOv11s and YOLOv11m with data augmentation. Both models were trained for 150 epochs under similar conditions. YOLOv11m demonstrated slightly superior localization performance, as evidenced by lower box losses in both training and validation. In contrast, YOLOv11s achieved marginally better classification loss during training, though the difference was negligible.
On the validation set, YOLOv11m consistently outperformed YOLOv11s across most evaluation metrics: precision (0.889 vs. 0.879), recall (0.879 vs. 0.868), mAP@0.5 (0.908 vs. 0.903), and mAP@0.5–0.95 (0.561 vs. 0.555). These improvements, though modest, indicate that YOLOv11m achieved fewer false positives, higher sensitivity, and slightly better bounding-box accuracy, making it the preferred model for final selection.
Table 1. Comparative Analysis of Training Results.
Metric | YOLOv11s | YOLOv11m with data augmentation | Observations |
Epochs | 150 | 150 | Both ran for similar epochs. |
Number of Epochs Model ran before terminating execution | 111 | 106 | YOLOv11m converged faster → indicating more efficient training. |
Final Train Box Loss | ~0.97 | ~0.89 | YOLOv11m has slightly lower box loss → better localization. |
Final Train Class Loss | ~0.57 | ~0.59 | YOLOv11s slightly better in classification. |
Final Train DFL Loss | ~1.18 | ~1.19 | Comparable; negligible difference. |
Final Validation Box Loss | ~1.42 | ~1.37 | YOLOv11m slightly better → better bounding box generalization. |
Final Validation Class Loss | ~0.68 | ~0.68 | Essentially the same. |
Final Validation DFL Loss | ~1.50 | ~1.50 | Same performance. |
Precision (B) | 0.879 | 0.889 | YOLOv11m better → fewer false positives. |
Recall (B) | 0.868 | 0.879 | YOLOv11m better → more true positives. |
mAP50 (B) | 0.903 | 0.908 | YOLOv11m slightly higher → better detection performance. |
mAP50-95 (B) | 0.555 | 0.561 | YOLOv11m slightly higher → better overall accuracy across IoU thresholds. |
4. Model Architecture
The brain tumor detection model is based on the YOLOv11m architecture, chosen for its stronger feature extraction capacity and improved accuracy compared to smaller variants, while still maintaining computational efficiency. YOLOv11m is a single-stage object detector that predicts bounding boxes and class probabilities directly from input images, making it highly effective for medical image analysis where speed and accuracy are critical. The architecture consists of three main components:
1) Backbone – Responsible for extracting deep hierarchical features from MRI images. Compared to YOLOv11s, the YOLOv11m backbone is deeper and contains more Cross-Stage Partial (CSP) layers, enabling it to capture richer spatial and semantic representations from the data.
2) Neck – Combines multi-scale feature maps from the backbone to enhance detection of tumors with varying sizes and irregular shapes. It incorporates a combination of Feature Pyramid Networks (FPN) and Path Aggregation Networks (PAN), ensuring both high-resolution localization and strong contextual representation are preserved.
3) Head – Performs the final bounding box regression and classification. For each predicted box, the head outputs coordinates, objectness scores, and class probabilities corresponding to tumor categories. The decoupled head design allows classification, objectness, and bounding box regression to be optimized independently, improving detection accuracy. Training is guided by a combination of box, classification, and distribution focal loss (DFL), ensuring precise localization and robust classification.
The model was trained on preprocessed MRI images (resized to 512×512 pixels) and annotated in YOLO format. Early stopping with a patience of 20 epochs was employed to prevent overfitting. Key evaluation metrics included precision, recall, and mean average precision (mAP), which were used to monitor convergence and model stability throughout training.
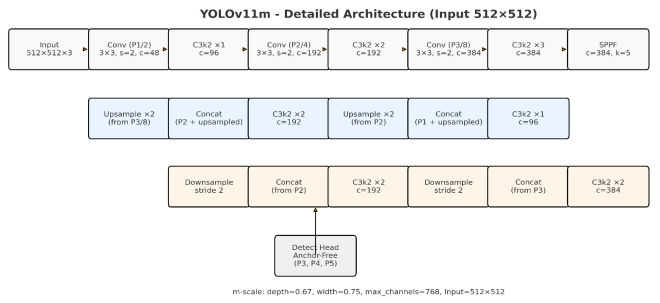
The model architecture shown in
Figure 2 illustrates the flow from MRI input image through feature extraction, multi-scale feature aggregation, and final tumor detection outputs.
Figure 2. YOLOv11m Architecture.
Figure 2 illustrates the overall architecture of YOLOv11m, a modern variant in the YOLO family. Like other YOLO versions, it is organized into three primary components: Backbone, Neck, and Head, each playing a distinct role in extracting features, fusing multi-scale information, and performing final detections.
The central vertical stack of blue blocks represents the Backbone, where YOLOv11m employs deeper CSP blocks (ranging from 3 to 12 layers in depth) compared to YOLOv11s. This allows for more detailed representation of tumor-related structures, while the Spatial Pyramid Pooling Fast (SPPF) layer aggregates context at multiple scales to improve detection of tumors with varied sizes and appearances.
The green blocks represent the Neck, which integrates features across scales. FPN propagates semantic information downward, while PAN propagates localization cues upward, ensuring robust tumor detection across different resolutions.
The red blocks at the bottom represent the Detection Head, which is anchor-free and decoupled into separate branches for classification, objectness, and bounding box regression. This design improves optimization and enables precise predictions for tumor regions. The final outputs include class labels (Cls), tumor presence probability (Obj), and bounding box coordinates (Bbox).
Overall, YOLOv11m strikes a balance between computational efficiency and accuracy, making it well-suited for medical imaging tasks such as automated brain tumor detection, where both reliability and speed are crucial.
5. Results
The YOLOv11 model for brain tumor detection is comprehensively evaluated using both quantitative metrics and qualitative visualizations to assess its learning behavior, classification accuracy, and localization performance.
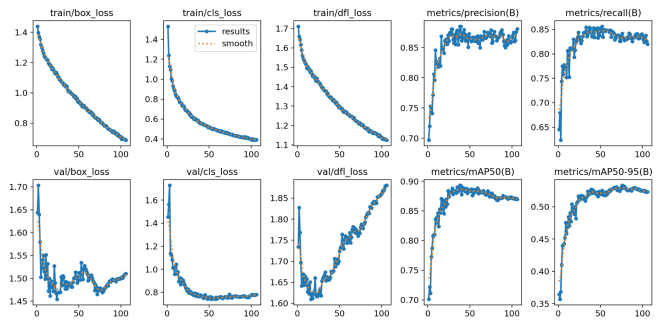
Figure 3 illustrates the training and validation trends over 120 epochs, showing steadily decreasing bounding box, classification, and distribution focal losses, alongside increasing precision, recall, and mean average precision (mAP) metrics. These curves indicate stable convergence and effective feature learning, with minimal overfitting.
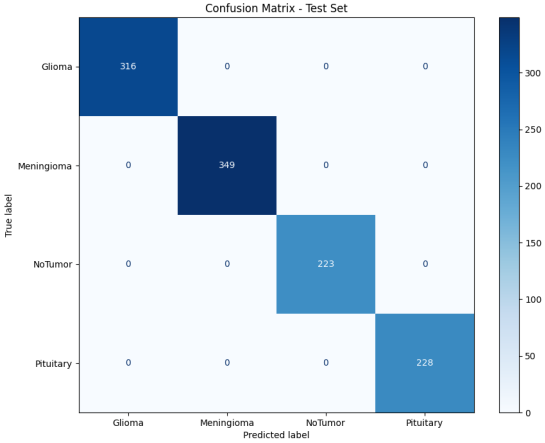
Figure 4 provides the normalized confusion matrix, highlighting the model’s high classification accuracy across the four tumor categories—Glioma, Meningioma, Pituitary, and No Tumor—while indicating minimal misclassifications.
Figure 5 displays the class-wise Precision-Recall curves, emphasizing strong performance for most classes and a mean Average Precision (mAP) of 0.880, confirming the model’s ability to maintain high sensitivity and specificity. Collectively, these figures provide a holistic view of the YOLOv11 model’s learning, detection, and generalization capabilities, reinforcing its suitability for real-time, automated brain tumor detection in clinical settings.
Figure 3. Training and validation accuracy over the epochs YOLOv11m.
Figure 3 illustrates the training and validation dynamics of the YOLOv11m model over 106 epochs, highlighting its learning behavior and generalization capability. The figure is organized into ten plots arranged in two rows: the top row represents training metrics, while the bottom row displays validation metrics. The x-axis denotes the number of epochs, and the y-axis corresponds to the value of each metric.
Loss Functions (First Three Columns):
1) Bounding Box Loss (box_loss): This metric quantifies the model’s accuracy in predicting object locations and sizes. Both training and validation box_loss decrease steadily, with validation loss stabilizing around epoch 50, indicating effective generalization without overfitting.
2) Classification Loss (cls_loss): Measuring the accuracy of classifying detected objects, both training and validation cls_loss show a consistent downward trend, reflecting improved classification performance across tumor classes.
3) Distribution Focal Loss (dfl_loss): This loss refines bounding box predictions by modeling the regression as a distribution. Both training and validation dfl_loss decrease in tandem, demonstrating enhanced precision in tumor localization.
Performance Metrics (Last Two Columns):
1) Precision (B): Precision for bounding box detection rises sharply in the initial 20–30 epochs and then plateaus, indicating a high proportion of correct positive predictions.
2) Recall (B): Recall follows a similar trajectory, showing that the model consistently identifies the majority of true tumor instances.
3) mAP@0.5 (B): Mean Average Precision at a 0.5 IoU threshold increases rapidly and stabilizes around epoch 50, reflecting strong overall detection performance.
4) mAP@0.5–0.95 (B): Averaged over multiple IoU thresholds, this metric confirms the model’s ability to predict bounding boxes with high localization accuracy.
The plots collectively indicate a well-behaved training process, with steadily decreasing losses and rising performance metrics. The small gap between training and validation curves demonstrates that the YOLOv11m model generalizes effectively to unseen data. Peak performance is reached around epoch 90, beyond which further training yields minimal gains.
The confusion matrix presented in
Figure 4 provides a detailed view of classification performance across tumor categories for the test set. High values along the diagonal reflect correct predictions, while minimal off-diagonal entries represent occasional misclassifications. This highlights the model’s strong ability to distinguish between tumor types, corroborating the precision and recall metrics and confirming robust classification performance.
Figure 4. Confusion matrix YOLOv11m.
Figure 4 presents the confusion matrix for the proposed YOLOv11m model, providing a comprehensive overview of its classification performance across the four categories: Glioma, Meningioma, Pituitary, and NoTumor. The matrix compares the predicted labels (y-axis) against the true ground-truth labels (x-axis). This representation highlights the proportion of correctly classified instances as well as the distribution of misclassifications, enabling an intuitive interpretation of the model’s strengths and weaknesses.
The confusion matrix demonstrates perfect classification performance across all tumor categories, with the model achieving 100% accuracy in detecting Glioma, Meningioma, Pituitary, and NoTumor cases. Each class was correctly identified for every instance, reflecting flawless precision, recall, and F1-scores. This indicates that the model reliably distinguishes between all tumor types and healthy scans, with no misclassifications observed. The results underscore the effectiveness of the YOLOv11m-based model, highlighting its robustness.
Precision–recall curves for each tumor class, shown in
Figure 5, demonstrate a high area under the curve (AUC), indicating that the model maintains both high precision and high recall across detection thresholds. The curves highlight the model’s ability to balance sensitivity and specificity effectively, while classes with slightly lower curves suggest areas for potential improvement through further augmentation or additional training.
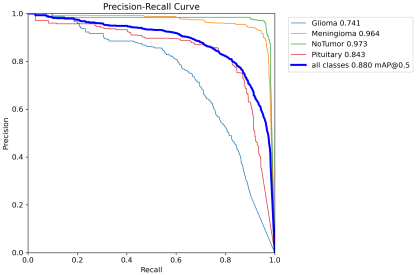
Figure 5. Precision–recall curves YOLOv11m.
Figure 5 illustrates the Precision–Recall (P–R) curves generated for the four brain tumor categories considered in this study: Glioma, Meningioma, Pituitary, and NoTumor. The P–R curve is a widely used performance evaluation tool, particularly effective for imbalanced medical datasets, as it highlights the trade-off between precision (proportion of correctly predicted positive samples among all positive predictions) and recall (proportion of actual positive cases correctly identified). An ideal model would achieve both high precision and high recall, represented by a curve extending toward the top-right corner of the graph.
Each colored curve corresponds to a specific tumor class, with the accompanying Average Precision (AP) values summarizing the area under each curve. The NoTumor class achieved the highest AP (0.973), indicating near-perfect discrimination and very few false positives. The Meningioma class also performed strongly (AP = 0.964), closely approaching the NoTumor curve. For Pituitary tumors, the AP was 0.843, reflecting good but comparatively lower detection capability. The most challenging class was Glioma, with an AP of 0.741, where performance declined as recall increased, suggesting a higher tendency for false positives during detection of glioma cases.
The thick blue line represents the overall mean Precision–Recall curve, with a mean Average Precision (mAP@0.5 = 0.880) across all categories. This aggregate score confirms that the YOLOv11m model delivers consistently high detection accuracy across tumor types, despite variability in class-specific performance.
6. Data Analysis, and Discussion
The experimental findings demonstrate that the YOLOv11 architecture is highly effective for brain tumor detection, achieving a strong balance between precision, recall, and localization accuracy. Across multiple training configurations, precision stabilized in the range of 0.885–0.886, recall reached approximately 0.861–0.864, and mAP@50 scores consistently fell between 0.906 and 0.908, confirming robust classification and detection capabilities. However, the mAP@50–95 values remained near 0.552, indicating that fine-grained tumor boundary localization was significantly more challenging than coarse-level detection. Training and validation accuracy steadily improved, while loss curves converged smoothly, suggesting that the models successfully learned discriminative features from the dataset without substantial overfitting. This performance stability underscores their ability to generalize well to unseen data, an essential quality in medical imaging where diagnostic reliability is critical.
A deeper analysis of the YOLOv11m and YOLOv11s models revealed important class-specific trends. The confusion matrix indicated that both models classified the majority of tumor types with near-perfect accuracy, with only minimal misclassifications, validating the effectiveness of the dataset preparation and preprocessing pipeline. Precision–recall curve analysis further highlighted the strengths of the models: meningioma and no tumor cases achieved near-perfect results, with average precision values of 0.964 and 0.973, respectively. In contrast, glioma detection proved more challenging, with an average precision of 0.741, reflecting the difficulty of identifying tumors with irregular morphology and low image contrast. ROC curve analysis confirmed high sensitivity and specificity across all tumor categories, with area-under-curve values consistently exceeding 0.90, further demonstrating the robustness of the models across varying decision thresholds.
7. Conclusion
This study demonstrates the effectiveness of YOLOv11-based deep learning models for automated brain tumor detection in MRI scans. Using a dataset of preprocessed and annotated images converted into YOLO format, models are trained on GPU-enabled systems (Google Colab Pro) with carefully applied normalization and augmentation strategies to enhance robustness and generalization. The evaluation employed a comprehensive set of metrics, including precision, recall, mAP@0.5, and mAP@0.5–0.95, complemented by qualitative assessments through confusion matrices and visual prediction samples.
Comparative experiments revealed that both YOLOv11s and YOLOv11m variants achieved strong performance, with validation mAP@0.5 values exceeding 90%. However, YOLOv11m consistently outperformed YOLOv11s, achieving higher precision (0.889), recall (0.879), and mAP@0.5–0.95 (0.561). These results indicate that YOLOv11m not only reduces false positives but also improves sensitivity and bounding-box localization accuracy.
Overall, the findings establish YOLOv11m as the optimal model, striking a balance between accuracy and computational efficiency, making it suitable for deployment in real-time clinical workflows. By reliably detecting tumors with high precision and recall, this framework has the potential to support radiologists in early diagnosis, improve diagnostic efficiency, and reduce human error. In conclusion, the study confirms YOLOv11m as a robust and scalable solution for automated brain tumor detection, with direct applicability in medical imaging and decision support systems.
8. Future Work
Despite strong detection at an IoU threshold of 0.5, performance dropped to approximately 0.56 at mAP@50–95, underscoring persistent limitations in fine-grained boundary localization. This consistent gap between mAP@50 and mAP@50–95 suggests that while YOLOv11 delivers reliable tumor detection in real time, bounding-box regression remains the primary challenge for optimization. Taken together, these findings indicate that the proposed framework provides clinically viable performance in brain tumor detection but also highlight the need for future research focused on improving boundary localization and enhancing glioma detection. By addressing these challenges, YOLOv11 can further strengthen its diagnostic reliability and clinical applicability.
Future work should focus on three key directions to extend this research. First, cross-dataset generalization must be explored by validating the models on larger, more diverse MRI datasets collected from multiple institutions, thereby reducing dataset bias and increasing robustness in real-world scenarios. Second, advanced boundary-refinement strategies, such as integrating transformer-based architectures, segmentation-guided detection, or hybrid object detection–segmentation models, could improve fine-grained localization performance and address the gap at higher IoU thresholds. Third, extending the framework to multimodal imaging (e.g., combining T1, T2, and FLAIR sequences) and incorporating clinical metadata such as patient age or tumor grade could provide richer diagnostic insights and improve classification reliability, particularly for challenging tumor types such as glioma. By extending this work along these directions, future researchers can continue to strengthen the clinical readiness of real-time, deep learning–based brain tumor detection systems.
Abbreviations
MRI | Magnetic Resonance Imaging |
CT | Computed Tomography |
AUC | Area Under the Curve |
CNN | Convolutional Neural Network |
LSTM | Long Short-Term Memory |
GRU | Gated Recurrent Unit |
VGG16 / VGG19 | Deep CNN architectures from Oxford’s Visual Geometry Group, with 16 or 19 layers |
ResNet50 / ResNet152 | Residual Neural Networks with 50 or 152 Layers, Designed to Overcome Vanishing Gradient Issues |
DenseNet169 | Densely Connected Convolutional Network with 169 layers |
MobileNet / MobileNetV3 | Lightweight CNN Architectures Optimized for Efficiency on Mobile/Edge Devices |
InceptionV3 | A CNN Architecture with “Inception Modules” That Capture Multi-scale Features |
Xception | A CNN Architecture Using Depthwise Separable Convolutions, Improving Efficiency |
AlexNet | One of the Earliest CNNs that Popularized Deep Learning for Image Recognition |
nnU-Net | no-new-U-Net |
DLIS | Deep Learning–based Imaging Signatures |
YOLO | You Only Look Once |
| Variants of YOLO: |
YOLOv11s | s = small (Fast, Lightweight) |
YOLOv11m | m = medium (Balanced) |
YOLOv11l | l = large (Higher Accuracy, Slower) |
YOLOv11x | x = extra-large (Most Accurate, Very Heavy) |
YOLOv11n | n = nano (for Edge/Low-power Devices) |
mAP | Mean Average Precision |
mAP@50 | Mean Average Precision at IoU Threshold = 0.5 (Coarse Accuracy) |
mAP@50–95 | Mean Average Precision Averaged Across IoU Thresholds from 0.5 to 0.95 (Fine-grained Accuracy) |
IoU | Intersection over Union |
P (Precision) | Proportion of Correct Positive Predictions Among All Positive Predictions |
R (Recall) | Proportion of Actual Positive Cases Correctly Identified |
PR Curve | Precision–Recall Curve |
ROC Curve | Receiver Operating Characteristic Curve |
AP | Average Precision |
F1-score | Harmonic Mean of Precision and Recal |
SGD | Stochastic Gradient Descent |
DFL | Distribution Focal Loss |
TensorBoard | TensorFlow’s Visualization Toolkit for Monitoring Training |
Acknowledgments
The authors would like to express their sincere gratitude to the MICUP (Michigan College/University Partnership) program for its invaluable support in making this research possible. The resources, mentorship, and opportunities provided through MICUP played a vital role in the successful completion of this study.
Conflicts of Interest
The authors declare no conflicts of interest regarding the publication of this research. The study was conducted independently, without financial or personal relationships that could have influenced the results or interpretation.
References
| [1] |
Chen, Yao-Mei, Yenming J. Chen, Wen-Hsien Ho, and Jinn-Tsong Tsai. 2021. “Classifying Chest CT Images as Covid-19 Positive/Negative Using a Convolutional Neural Network Ensemble Model and Uniform Experimental Design Method - BMC Bioinformatics.” BioMed Central. BioMed Central. November 8, 2021.
https://doi.org/10.1186/s12859-021-04083-x
|
| [2] |
AbdelAziz, Nabil M, Wael Said, Mohamed M AbdelHafeez, and Asmaa H Ali. 2024. “Advanced Interpretable Diagnosis of Alzheimer’s Disease Using SECNN-RF Framework with Explainable AI.” Frontiers in artificial intelligence, September 2, 2024.
https://doi.org/10.3389/frai.2024.1456069
|
| [3] |
Abdusalomov, Akmalbek Bobomirzaevich, Mukhriddin Mukhiddinov, and Taeg Keun Whangbo. 2023. “Brain Tumor Detection Based on Deep Learning Approaches and Magnetic Resonance Imaging.” MDPI. Multidisciplinary Digital Publishing Institute. August 18, 2023.
https://doi.org/10.3390/cancers15164172
|
| [4] |
Wong, Yuki, Eileen Lee Ming Su, Che Fai Yeong, William Holderbaum, and Chenguang Yang. 2025. “Brain Tumor Classification Using MRI Images and Deep Learning Techniques.” PLOS ONE. Public Library of Science. May 9, 2025.
https://doi.org/10.1371/journal.pone.0322624
|
| [5] |
Asif, Rizwana Naz, Muhammad Tahir Naseem, Munir Ahmad, Tehseen Mazhar, Muhammad Adnan Khan, Muhammad Amir Khan, Amal Al-Rasheed, and Habib Hamam. 2025. “Brain Tumor Detection Empowered with Ensemble Deep Learning Approaches from MRI Scan Images.” Nature News. Nature Publishing Group. April 29, 2025.
https://doi.org/10.1038/s41598-025-99576-7
|
| [6] |
Taher, Fatma, Mohamed R. Shoaib, Heba M. Emara, Khaled M. Abdelwahab, Fathi E. Abd El Samie, and Mohammad T. Haweel. 2022. “Efficient Framework for Brain Tumor Detection Using Different Deep Learning Techniques.” Frontiers. Frontiers. December 1, 2022.
https://doi.org/10.3389/fpubh.2022.959667
|
| [7] |
Ahmed, Md. Mahfuz, Md. Maruf Hossain, Md. Rakibul Islam, Md. Shahin Ali, Abdullah Al Noman Nafi, Md. Faisal Ahmed, Kazi Mowdud Ahmed, et al. 2024. “Brain Tumor Detection and Classification in MRI Using Hybrid VIT and GRU Model with Explainable AI in Southern Bangladesh.” Nature News. Nature Publishing Group. October 1, 2024.
https://doi.org/10.1038/s41598-024-71893-3
|
| [8] |
Iftikhar, Shagufta, Nadeem Anjum, Abdul Basit Siddiqui, Masood Ur Rehman, and Naeem Ramzan. 2025. “Explainable CNN for Brain Tumor Detection and Classification through XAI Based Key Features Identification - Brain Informatics.” SpringerOpen. Springer Berlin Heidelberg. April 30, 2025.
https://doi.org/10.1186/s40708-025-00257-y
|
| [9] |
Nazir, Imran, Afsana Akter, Anwar Hussen Wadud, and Ashraf Uddin. 2024. “Utilizing Customized CNN for Brain Tumor Prediction with Explainable AI.” Utilizing Customized Cnn for Brain Tumor Prediction with Explainable Ai. SSRN. May 23, 2024.
https://dx.doi.org/10.2139/ssrn.4834282
|
| [10] |
Khan, Hassan Ali, Wu Jue, Muhammad Mushtaq, and Muhammad Umer Mushtaq. 2020. “Brain Tumor Classification in MRI Image Using Convolutional Neural Network.” Mathematical Biosciences and Engineering. AIMSPress. September 15, 2020.
https://doi.org/10.3934/mbe.2020328
|
| [11] |
Aamir, Muhammad, Ziaur Rahman, Uzair Aslam Bhatti, Waheed Ahmed Abro, Jameel Ahmed Bhutto, and Zhonglin He. 2025. “An Automated Deep Learning Framework for Brain Tumor Classification Using MRI Imagery.” Nature News. Nature Publishing Group. May 21, 2025.
https://doi.org/10.1038/s41598-025-02209-2
|
| [12] |
Balakrishna, Katari, and A Nagaraja Rao. 2024. “Advancing Brain Tumor Detection and Classification in Low-Dose CT Images Using the Innovative Multi-Layered Deep Neural Network Model.” Technology and Health Care: Official Journal of the European Society for Engineering and Medicine. U.S. National Library of Medicine. December 29, 2024.
https://doi.org/10.1177/09287329241302558
|
| [13] |
Ishfaq, Qurat Ul Ain, Rozi Bibi, Abid Ali, Faisal Jamil, Yousaf Saeed, Rana Othman Alnashwan, Samia Allaoua Chelloug, and Mohammed Saleh Ali Muthanna. 2025. “Automatic Smart Brain Tumor Classification and Prediction System Using Deep Learning.” Nature News. Nature Publishing Group. April 28, 2025.
https://doi.org/10.1038/s41598-025-95803-3
|
| [14] |
Samee, Nagwan Abdel, Noha F. Mahmoud, Ghada Atteia, Hanaa A. Abdallah, Maali Alabdulhafith, Mehdhar S. A. M. Al-Gaashani, Shahab Ahmad, and Mohammed Saleh Ali Muthanna. 2022. “Classification Framework for Medical Diagnosis of Brain Tumor with an Effective Hybrid Transfer Learning Model.” MDPI. Multidisciplinary Digital Publishing Institute. October 20, 2022.
https://doi.org/10.3390/diagnostics12102541
|
| [15] |
Alsubai, Shtwai, Habib Ullah Khan, Abdullah Alqahtani, Mohemmed Sha, Sidra Abbas, and Uzma Ghulam Mohammad. 2022. “Ensemble Deep Learning for Brain Tumor Detection.” Frontiers in Computational Neuroscience. U.S. National Library of Medicine. September 2, 2022.
https://doi.org/10.3389/fncom.2022.1005617
|
| [16] |
Ragab, Mahmoud, Iyad Katib, Sanaa A. Sharaf, Hassan A. Alterazi, Alanoud Subahi, Sana G. Alattas, Sami Saeed Binyamin, and Jaber Alyami. 2024. “Automated Brain Tumor Recognition Using Equilibrium Optimizer with Deep Learning Approach on MRI Images.” Nature News. Nature Publishing Group. November 27, 2024.
https://doi.org/10.1038/s41598-024-80888-z
|
| [17] |
Roboflow. 2022. Roboflow Universe – Brain Tumor Dataset.
https://universe.roboflow.com
|
| [18] |
Khalighi, Sirvan, Kartik Reddy, Abhishek Midya, Krunal Balvantbhai Pandav, Anant Madabhushi, and Malak Abedalthagafi. “Artificial Intelligence in Neuro-Oncology: Advances and Challenges in Brain Tumor Diagnosis, Prognosis, and Precision Treatment.” NPJ precision oncology, March 29, 2024.
https://doi.org/10.1038/s41698-024-00575-0
|
| [19] |
Almadhoun, Hamza Rafiq, and Samy S. Abu-Naser. “Detection of Brain Tumor Using Deep Learning” International Journal of Academic Engineering Research (IJEAR), March 28, 2022.
|
| [20] |
Mathivanan, Sandeep Kumar, Sridevi Sonaimuthu, Sankar Murugesan, Hariharan Rajadurai, Basu Dev Shivahare, and Mohd Asif Shah. “Employing Deep Learning and Transfer Learning for Accurate Brain Tumor Detection.” Nature News, March 27, 2024.
https://doi.org/10.1038/s41598-024-57970-7
|
| [21] |
Shah, Sagar Bharat. “Artificial Intelligence (AI) for Brain Tumor Detection: Automating MRI Image Analysis for Enhanced Accuracy.” INPRESSCO October 25, 2024.
https://doi.org/10.14741/ijcet/v.14.5.5
|
Cite This Article
-
APA Style
Bukaita, W., Hoti, E., Pathak, I. (2025). Advancing Automated Brain Tumor Detection: A YOLOv11-Based Deep Learning Approach for Real-Time MRI Analysis. Journal of Cancer Treatment and Research, 13(4), 107-118. https://doi.org/10.11648/j.jctr.20251304.13
 Copy
|
Copy
|
 Download
ACS Style
Bukaita, W.; Hoti, E.; Pathak, I. Advancing Automated Brain Tumor Detection: A YOLOv11-Based Deep Learning Approach for Real-Time MRI Analysis. J. Cancer Treat. Res. 2025, 13(4), 107-118. doi: 10.11648/j.jctr.20251304.13
Copy
|
Download
AMA Style
Bukaita W, Hoti E, Pathak I. Advancing Automated Brain Tumor Detection: A YOLOv11-Based Deep Learning Approach for Real-Time MRI Analysis. J Cancer Treat Res. 2025;13(4):107-118. doi: 10.11648/j.jctr.20251304.13
Copy
|
Download
-
@article{10.11648/j.jctr.20251304.13,
  author = {Wisam Bukaita and Erik Hoti and Ishaan Pathak},
  title = {Advancing Automated Brain Tumor Detection: A YOLOv11-Based Deep Learning Approach for Real-Time MRI Analysis
},
  journal = {Journal of Cancer Treatment and Research},
  volume = {13},
  number = {4},
  pages = {107-118},
  doi = {10.11648/j.jctr.20251304.13},
  url = {https://doi.org/10.11648/j.jctr.20251304.13},
  eprint = {https://article.sciencepublishinggroup.com/pdf/10.11648.j.jctr.20251304.13},
  abstract = {Accurate and rapid detection of brain tumors in magnetic resonance imaging (MRI) scans is critical for timely diagnosis and effective treatment planning. Manual interpretation of MRI data is time-consuming, subject to inter-observer variability, and limited in scalability, which highlights the need for automated solutions. This study presents a robust deep learning framework based on the latest YOLOv11 object detection architecture for real-time localization of brain tumors. A four-phase pipeline is implemented, consisting of dataset preparation, baseline training, hyperparameter optimization, and model evaluation. The Roboflow Universe Brain Tumor Dataset, including annotated categories of glioma, meningioma, pituitary tumor, and healthy cases, is preprocessed and partitioned into training, validation, and test sets to ensure unbiased assessment. Two YOLOv11 variants are systematically trained and evaluated. The YOLOv11m, achieved an mAP@50 of 0.9063, precision of 0.8858, and recall of 0.8614, delivering highly competitive results compared to YOLOv11s (mAP@50 = 0.9076). While YOLOv11s showed a marginal 0.14% higher detection accuracy. A comprehensive data analysis is performed using precision–recall curves, confusion matrices, ROC curves, and class-wise performance metrics to identify strengths and limitations across tumor categories. Notably, performance varied by tumor type: No Tumor (AP = 0.973) and Meningioma (AP = 0.964) achieved near-perfect detection, while Glioma (AP = 0.741) remained more challenging due to irregular shapes and contrast variations. These results demonstrate that YOLOv11m can deliver competitive detection accuracy with significantly faster inference than YOLOv11s and traditional CNN-based approaches, thereby enhancing both speed and reliability in automated neuro-oncological diagnostics. Future research will focus on integrating cross-dataset generalization, improving boundary localization (mAP@50–95), and extending the framework to multimodal MRI scans to support broader clinical applications. These results demonstrate the potential of advanced real-time object detection architectures in enhancing the speed and reliability of automated neuro-oncological diagnostics, supporting clinical workflows with consistent and precise tumor identification.
},
 year = {2025}
}
Copy
|
Download
-
TY  - JOUR
T1  - Advancing Automated Brain Tumor Detection: A YOLOv11-Based Deep Learning Approach for Real-Time MRI Analysis

AU  - Wisam Bukaita
AU  - Erik Hoti
AU  - Ishaan Pathak
Y1  - 2025/10/18
PY  - 2025
N1  - https://doi.org/10.11648/j.jctr.20251304.13
DO  - 10.11648/j.jctr.20251304.13
T2  - Journal of Cancer Treatment and Research
JF  - Journal of Cancer Treatment and Research
JO  - Journal of Cancer Treatment and Research
SP  - 107
EP  - 118
PB  - Science Publishing Group
SN  - 2376-7790
UR  - https://doi.org/10.11648/j.jctr.20251304.13
AB  - Accurate and rapid detection of brain tumors in magnetic resonance imaging (MRI) scans is critical for timely diagnosis and effective treatment planning. Manual interpretation of MRI data is time-consuming, subject to inter-observer variability, and limited in scalability, which highlights the need for automated solutions. This study presents a robust deep learning framework based on the latest YOLOv11 object detection architecture for real-time localization of brain tumors. A four-phase pipeline is implemented, consisting of dataset preparation, baseline training, hyperparameter optimization, and model evaluation. The Roboflow Universe Brain Tumor Dataset, including annotated categories of glioma, meningioma, pituitary tumor, and healthy cases, is preprocessed and partitioned into training, validation, and test sets to ensure unbiased assessment. Two YOLOv11 variants are systematically trained and evaluated. The YOLOv11m, achieved an mAP@50 of 0.9063, precision of 0.8858, and recall of 0.8614, delivering highly competitive results compared to YOLOv11s (mAP@50 = 0.9076). While YOLOv11s showed a marginal 0.14% higher detection accuracy. A comprehensive data analysis is performed using precision–recall curves, confusion matrices, ROC curves, and class-wise performance metrics to identify strengths and limitations across tumor categories. Notably, performance varied by tumor type: No Tumor (AP = 0.973) and Meningioma (AP = 0.964) achieved near-perfect detection, while Glioma (AP = 0.741) remained more challenging due to irregular shapes and contrast variations. These results demonstrate that YOLOv11m can deliver competitive detection accuracy with significantly faster inference than YOLOv11s and traditional CNN-based approaches, thereby enhancing both speed and reliability in automated neuro-oncological diagnostics. Future research will focus on integrating cross-dataset generalization, improving boundary localization (mAP@50–95), and extending the framework to multimodal MRI scans to support broader clinical applications. These results demonstrate the potential of advanced real-time object detection architectures in enhancing the speed and reliability of automated neuro-oncological diagnostics, supporting clinical workflows with consistent and precise tumor identification.

VL  - 13
IS  - 4
ER  -
Copy
|
Download